

In a previous post, we talked about the most common terms you may come across when using Google Analytics (GA). But knowing a few terms is not enough to make the most of this tool. For this, you also have to know how to read GA reports.
To begin with, some of the most essential elements included in GA reports are the traffic metrics. Why? Because they indicate the most and the least important areas of your site, helping you understand what you need to improve in order to drive in more targeted traffic. Here is how you should analyse and interpret these metrics.
GA Reports Overview Page
When checking the Overview report, you should pay attention to Users, Bounce Rate and % Exit. By analysing these three elements, you can easily determine how many users have found your website useful.
For instance, if the GA reports display 120,000 Users, a Bounce Rate of 85%, and an Exit rate of 83%, it means that 102,000 (85%) out of 120,000 users who have visited your website left within several seconds, without visiting other pages, while 99,600 users (83%) left your website after browsing other pages.
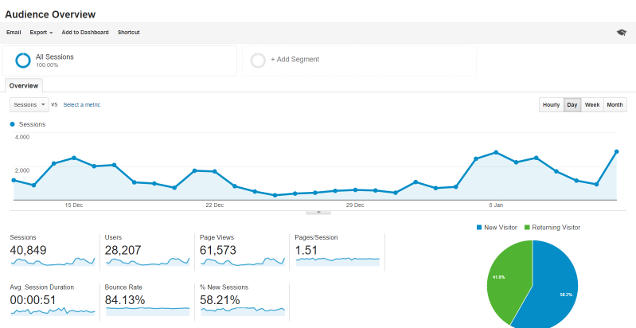
Additionally, if you take a look at Time on Page and Time on Site, you can find out how long each visitor has spent on average on each of your webpages and site, respectively. If Time on Page shows 00:02:55, it means that each visitor has spent almost three minutes on each page, which is quite satisfactory.
These metrics not only indicate how effective your website is, but also affect your site’s ranking. To boost your ranking, you need to attract more users and get them to spend more time browsing your site, which will result in lower bounce and exit rates.
Pages
The Pages report reveals the webpages people have used to enter your site. This report is important because it points out which pages attract and which pages chase away visitors, the number of clicks and impressions your pages are receiving, the average ranking position, and the average click-through rate.
When checking the Pages report, you should also click Destination Page to see which webpages have been viewed by users following particular searches. As well, you should cross-reference the Pages report with Queries report, which points out the keywords and key-phrases for which your website ranks high in search engines.
Location
Knowing how many users are accessing your site from specific locations around the world can help you understand whether your “Google+ Local” strategy is working or not. If you go to Audience > Demographics > Location, you will find a world map that displays darker shades of green to reveal your users’ locations. If multiple geographical locations are highlighted, you should focus more on local SEO strategies (e.g. incorporating geo-targeted keywords into your website’s content and creating Google+ local pages) in order to promote your business locally.
Web Browsers
You can also use GA reports to obtain details regarding the web browsers people use to find your site. To view these details, you must go to Audience, select Technology and then Browser on the Primary Dimension screen. By checking browser-related data, for example, you can find out that Internet Explorer users abandon your website within several seconds after accessing it. This may help you identify and solve specific issues, such as slow loading times or a bug in the layout.
Mobile Traffic
As mobile technologies continue to evolve and consumer preferences shift, it is critical to analyse the way your websites works on mobile devices. To access the Mobile Traffic report, go to Audience, then to Mobile, and select Overview or Devices.
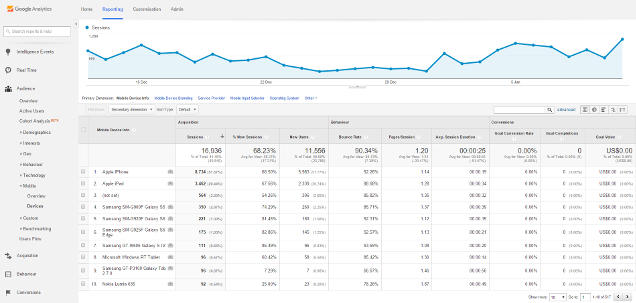
While the Overview report provides data based on the devices (desktop, mobile phones, and tablets) visitors have used to access your website, the Devices report breaks down mobile site traffic by device brand and model. Mobile traffic data reveals how users are interacting with your site on their mobile devices, helping you identify opportunities to increase your mobile web presence and attract more visitors.
Traffic Sources
The Traffic Sources report provides valuable insight into the sources that direct users toward your site. When checking your GA reports, you will see that your traffic comes from four different sources: search engines, direct traffic (e.g. bookmarks and URLs typed directly into the search bar), other websites, and RSS feeds. According to industry experts, you should maintain an even balance between all these sources. As an example, you can swap links with other relevant websites or include links to your webpages in messages posted on forums and social media sites when visitor traffic from other websites decreases.
GA Goals and Conversion Tracking
By configuring GA goals and conversion tracking, you can get detailed information about certain visitors, such as those who has filled out your contact form, signed up for your newsletter, bought your products, etc. Accurate, timely information eliminates guesswork and empowers you to make smarter decisions, which could help you convert more visitors into leads and customers.